How to Extract OIFITS Data Using IDL Utilities
Download the IDL OIFITS Library - maintained by John Monnier at the University of Michigan.
Inside the IDL OIFITS Library are two test files called testdata.fits and bigtest.fits. The bigtest.fits contains several tables to demonstrate the full richness of the OIFITS data format, although the values are nonsensical.
Read the OIFITS Tables
The routine "read_oidata" will provide an inventory of the tables contained in the OIFITS file and read in those tables:
IDL> read_oidata, 'testdata.fits', oiarray, oitarget, oiwavelength, oivis, oivis2, oit3, /inventory
This file Satisfies the requirements of the OI_DATA format
Inventory:
OI_ARRAY: 1
OI_TARGET: 1
OI_WAVELENGTH: 1
OI_VIS: 1
OI_VIS2: 1
OI_T3: 1
Unknown Tables: 0
IDL> print, oivis2(0).time, *oivis2(0).vis2data, *oivis2(0).vis2err
82810.000 0.67700000 0.064000000
However, the visibility data are stored as pointers when using read_oidata. To extract and manipulate the data, use the routines extract_vis2data and extract_t3data described below.
Extract Visibility Amplitudes:
IDL> extract_vis2data, file='bigtest.fits', vis2data
The data are stored in arrays of structures. To view the contents of the file, use the "help" command with the "/structure" flag:
IDL> help, vis2data, /st
** Structure <1474b28>, 26 tags, length=224, data length=207, refs=1:
| OI_REVN | INT | 1 |
| DATE_OBS | STRING | 2004-01-11 |
| ARRNAME | STRING | CHARA_2004Jan |
| INSNAME | STRING | CHARA_MIRC |
| EFF_WAVE | DOUBLE | 1.4000000e-06 |
| EFF_BAND | DOUBLE | 5.0000001e-08 |
| WAVE_ID | INT | 0 |
| TARGET_ID | INT | 0 |
| TARGET | STRING | 'alp_ori' |
| RA | DOUBLE | 0.0000000 |
| DEC | DOUBLE | 10.000000 |
| EQUINOX | FLOAT | 2000.00 |
| TIME | DOUBLE | 0.0000000 |
| MJD | DOUBLE | 0.0000000 |
| INT_TIME | DOUBLE | 2.0000000 |
| VIS2DATA | DOUBLE | 0.0000000 |
| VIS2ERR | DOUBLE | 0.020000000 |
| UCOORD | DOUBLE | 0.0000000 |
| U | DOUBLE | 0.0000000 |
| V | DOUBLE | 0.0000000 |
| SFU | DOUBLE | 0.0000000 |
| BASELINE | DOUBLE | 0.0000000 |
| PA | DOUBLE | 0.0000000 |
| STA_INDEX | INT | Array[2] |
| FLAG | BYTE | 70 |
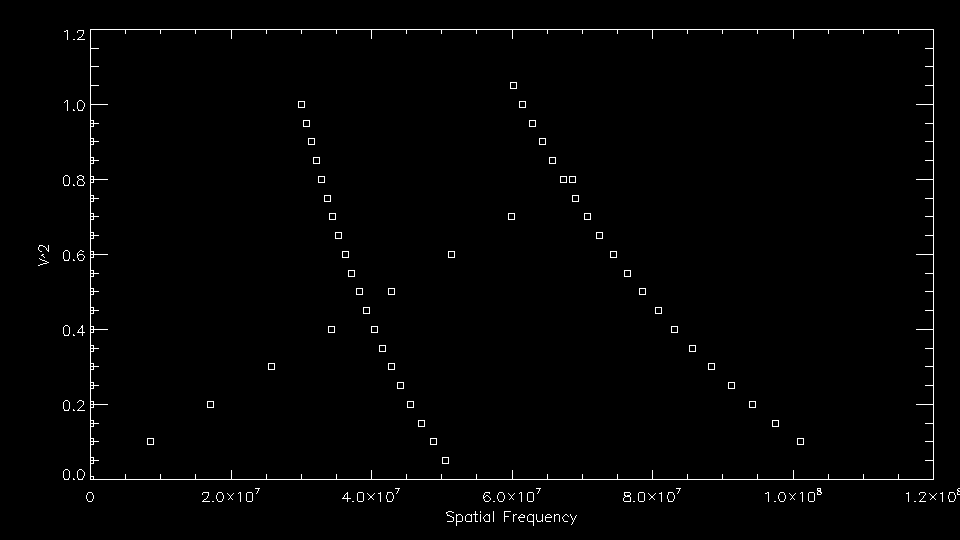
Then you can print, plot, and manipulate any of these arrays as follows:
IDL> plot, vis2data.sfu, vis2data.vis2data, psym=6, xtitle='Spatial Frequency', ytitle='V^2'
Extract Closure Phases:
IDL> extract_t3data, file='bigtest.fits', t3data
The data are stored in arrays of structures. To view the contents of the file, use the "help" command with the "/structure" flag:
IDL> help, t3data, /st
** Structure <17fc358>, 39 tags, length=328, data length=313, refs=1:
| OI_REVN | INT | 1 |
| DATE_OBS | STRING | '2004-01-11' |
| ARRNAME | STRING | 'CHARA_2004Jan' |
| INSNAME | STRING | 'CHARA_MIRC' |
| EFF_WAVE | DOUBLE | 1.4000000e-06 |
| EFF_BAND | DOUBLE | 5.0000001e-08 |
| WAVE_ID | INT | 0 |
| TARGET_ID | INT | 0 |
| TARGET | STRING | 'alp_ori ' |
| RA | DOUBLE | 0.0000000 |
| DEC | DOUBLE | 10.000000 |
| EQUINOX | FLOAT | 2000.00 |
| TIME | DOUBLE | 0.0000000 |
| MJD | DOUBLE | 0.0000000 |
| INT_TIME | DOUBLE | 2.0000000 |
| T3AMP | DOUBLE | 0.0000000 |
| T3AMPERR | DOUBLE | 0.020000000 |
| T3PHI | DOUBLE | 0.0000000 |
| T3PHIERR | DOUBLE | 0.0000000 |
| U1COORD | DOUBLE | 0.0000000 |
| V1COORD | DOUBLE | 0.0000000 |
| U1 | DOUBLE | 0.0000000 |
| V1 | DOUBLE | 0.0000000 |
| BASELINE1 | DOUBLE | 0.0000000 |
| PA1 | DOUBLE | 0.0000000 |
| U2COORD | DOUBLE | 0.0000000 |
| V2COORD | DOUBLE | 0.0000000 |
| U2 | DOUBLE | 0.0000000 |
| V2 | DOUBLE | 0.0000000 |
| BASELINE2 | DOUBLE | 0.0000000 |
| PA2 | DOUBLE | 0.0000000 |
| U3COORD | DOUBLE | 0.0000000 |
| V3COORD | DOUBLE | 0.0000000 |
| U3 | DOUBLE | 0.0000000 |
| V3 | DOUBLE | 0.0000000 |
| BASELINE3 | DOUBLE | 0.0000000 |
| PA3 | DOUBLE | 0.0000000 |
| STA_INDEX | INT | Array[3] |
| FLAG | BYTE | 70 |
Then you can print, plot, and manipulate any of these arrays as follows:
IDL> plot, t3data.mjd, t3data.t3phi, psym=6